
Standing at the Route 79 bus stop outside Alperton tube station on the way home from work last night. The darkness and sharp gusts of wind made me shrink back into my jacket as far as I could go. Winter, it seems, is definitely setting in.
My mind wanders as I half-notice several Route 83 buses go by. Why are there so many more 83s than 79s? The scientist in me suggested that I was just imagining it. “It just feels that way” - I tried to convince myself. I’m sure if I were to count the inter-arrival times of the 79 bus I would get a perfectly normal distribution around a mean wait time of around 10 minutes.
My mind wandered further - yes - “normal distribution”. Imagery of me sitting in a concrete-block lecture theatre at college flash through my mind. Me sitting there chewing the end of my biro - staring down at row upon row of student droids listening attentively to the statistics lecturer droning on in monotone about “how important the standard normal distribution is to society”. Daydreaming - when I should have been paying attention.
I read Physics at college. Unfortunately, Statistics was a compulsory module. I failed the first-year paper - and had to sit a re-take in the summer holidays - which I luckily only just passed. Little did I appreciate then how important this mind-numbing topic would be later on in life.
Because that’s exactly the point: of all the abstract things I learned at university (apart from the extra-cirricular stuff) there really is only ONE thing that has carried through as essential in later life. And that’s statistics. Yes - damned statistics! The biggest truth that the statistics lecturer didn’t lie about! In fact - I quite often at work find myself applying the methods of the “normal distribution” (or “bell curve” as some people call it) to the raw data that I have in my posession from time to time. Without it - life would be so hard to predict - and I really mean that.
To underline my firm belief in the importance of the normal distribution - this most GENIUS of a statistical method - I am going to give a brief treatment on it - and I am appealing to you to spend a couple of minutes of your precious time and pay attention. Especially all you college students out there - who are not supposed to be wasting your time aimlessly surfing the Internet and reading other people’s blogs: if there’s one thing that you should certainly value from your college education it is this. (In fact, your exam results and final grade are probably determined by it!)
In order to make it more interesting for those of you who are bored already I have asked my second-best friend Aishwarya Rai (famous Indian cinema actress - rumoured to possibly be starring in a future James Bond movie?) to give the mathematics lesson.
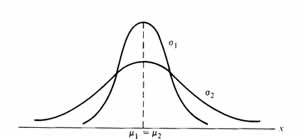
Normal Distribution Figure 1. The normal curve. A continuous random variable X having the bell-shaped distribution of Figure 1 is called a normal random variable. The mathematical equation for the probability distribution of the normal variable depends upon the two parameters u and o, its mean and standard deviation. Hence I denote the values of the density function of X by n(x;u,o) The density function of the normal random variable X, with a mean u and standard deviation o, is You think that’s intense? Once u and o are specified, the normal curve is completely determined. For example, if u=50 and o=5, then the ordinates n(x;50,5) can easily be computed for various values of x and the curve drawn. In Figure 2 I have sketched two normal curves having the same standard deviation but different means. The two curves are identical in form but are centred at different positions along the horizontal axis. Figure 2. Normal curves with u1<u2 and o1=o2. In Figure 3 I have sketched two normal curves with the same means but different standard deviations. This time you can see that the two curves are centred at exactly the same position on the horizontal axis, but the curve with the larger standard deviation is lower and spreads out farther. Remember that the area under a probability curve must be equal to 1 and therefore the more variable the set of observations the lower and wider the corresponding curve will be. Makes sense? Figure 3. Normal curves with u1=u2 and o1<o2. Figure 4 shows the results of me sketching two normal curves having different means and different standard deviations. Clearly, they are centred at different positions on the horizontal axis and their shapes reflect the two different values of o. Get it? From an inspection of Figures 1 through 4 and by examination of the first and second derivatives of n(x;u,o), I can now list the following properties of the normal curve: 1. The mode, which is the point on the horizontal axis where the curve is a maximum, occurs at x=u. 2. The curve is symmetric about a vertical axis through the mean u. 3. The curve has its points of inflection at x=u+o and x=u-o 4. The normal curve approaches the horizontal axis asymptotically as we proceed in either direction away from the mean. 5. The total area under the curve above the horizontal axis is equal to 1. Figure 4. Normal curves with u1<u2 and o1<o2. Areas Under the Normal Curve The curve of any continuous probability distribution or density function is constructed so that the area under the curve (yes under the curve) bounded by two ordinates x=x1 and x=x2, equals the probability that the random variable X assumes a value between x=x1 and x=x2. Thus for the normal curve in Figure 5, is represented by the area of the shaded region. The shaded region under the curve below! Figure 5. P(x1 < X < x2) = area of the shaded region . In Figures 2, 3 and 4 we saw how the normal curve is dependent on the mean and the standard deviation of the distribution under investigation. The area under the curve between any two ordinates must then also depend on the values of u and o. This is evident in Figure 6, where I have shaded regions corresponding to P(x1 < X < x2) for two curves with different means and variances. The P(x1 < X < x2), where X is the random variable describing distribution I, is indicated by the darker shaded area. If X is the random variable describing distribution II, then P(x1 < X < x2) is given by the entire shaded region. Obviously, the two shaded regions are different in size; therefore, the probability associated with each distribution will be different for the two given values of X. Obviously. Figure 6. P(x1 < X < x2) for different normal curves. The difficulty encountered in solving integrals of normal density functions necessitates the tabulation of normal curve areas for quick reference. However, it would be a hopeless task to attempt to set up separate tables for every conceivable value of u and o. Fortunately, as you should already know, we are able to transform all the observations of any normal random variable Z with mean zero and variance 1. This can be done by the means of the transformation Whenever X assumes a value x, the corresponding value of Z is given by z-(x-u)/o. Therefore, if X falls between the values x=x1 and x=x2, the random variable Z will fall between the corresponding values z1=(x1-u)/o and z2=(x2-u)/o. Beautiful isn’t it? Consequently, we may write Where Z is seen to be a normal random variable with mean zero and variance 1. Definition: The distribution of a normal random variable with mean zero and variance 1 is called a standard normal distribution. The original and transformed distributions are illustrated in Figure 7. Since all the values of X falling between x1 and x2 have corresponding z values between z1 and z2, the area under the X curve between the ordinates x=x1 and x=x2 in Figure 7 equals the area under the Z curve between the transformed ordinates z=z1 and z=z2. Figure 7. The original and transformed normal distributions.. So - we have now reduced the required number of tables of the normal-curve areas to one, that of the standard normal distribution! That was easy wasn’t it?

Let me remind you that the most important continuous probability distribution in the entire field of statistics is the normal distribution. Its graph, called the normal curve, is the bell-shaped curve of Figure 1, which describes so many sets of data that occur in nature, industry and research. In 1733 Abraham DeMoivre developed the mathematical equation of the normal curve. It provided a basis upon which much of the theory of inductive statistics is founded. The normal distribution is often referred to as the Gaussian distribution in honour of Karl Friedrich Gauss (1777-1855), who also derived its equation from a study of errors in repeated measurements of the same quantity.


![]()


If you would like to download the Standard Normal Distribution table of z values - then you can do so by going to the this page.
And if you would like to see if any raw data that you have is normally distributed (and you have Microsoft Excel)- then all you have to to is follow these instructions:
Get your measured data into a column in a worksheet. Open up a new worksheet and create a new column for your “interval slots”. So - let’s say for example you are measuring the time it takes for the bus to arrrive over several hundred waits at your bus stop (although probably only Diamond Geezer would actually do something like that!) - then create a column with the values 1 through to say 30 - representing the minutes you might have to wait for the bus. Then enter an “array function” into the right hand colum just adjacent to it - but which is exactly one row longer (underneath) than the interval slots column. To enter an “array function” - you select the cells (as I said - the adjacent column but with an extra row at the bottom) and then press “equals” at the top to enter the function. The function you need is “FREQUENCY” and up should pop-up a “series filler” dialogue box. Fill the “data” series by going to the first worksheet and highlighting the data of your measured values column - and then fill the “results” series by re-highlighting your results column next to your interval slots in the second worksheet. And then: this is is the most important thing: press control-shift-enter to commit the function! And - as if by magic - your results column will contain the frequency counts for the intervals! Now all you need to do is to use the chartwizard to plot it as a line graph - and if it looks bell-shaped like in the above lesson - then the data can be said to be normally distributed!
Enjoy!
Posted by jag at November 15, 2003 11:13 AMHeck! This reminded me of the intense DMAIC classes I had to attend many moons ago that even though I hardly touch hard alcohol, after 12 hrs of lectures, the whole class needed to hit the bar and I wd go for Southern Comfort to clear the brains…reading this makes me feel dizzzzy! I was lousy at Maths in school, strange how it catchs up later in one’s life. BTW, Minitab is an excellent tool as well to get even more detailed results.
Posted by: Ritu on November 15, 2003 11:08 PMHi Ritu, Southern Comfort?! What kind of college did you go to? We sought solace in vodka (it’s all we could afford - and is stronger!)
Hey: I remember Minitab! You used that too? I thought Minitab was something peculiar to our college ! Yes - I remember it being quite good - if not a bit quirky.
Posted by: Jag on November 16, 2003 07:40 AMSorry Jag, I gave up half way through. Nice pictures though! ;-)
Posted by: Stu on November 16, 2003 12:06 PMNever mind Stu. Glad you enjoyed the pics!
Posted by: Jag on November 16, 2003 09:12 PMgot distracted by the pics…next time try pictures of…i don’t…vegatables or something a little less beautiful.
btw, second best-friend, who was the first? oh…your wife.. probalby right…? :)
Posted by: mamatha on November 16, 2003 09:44 PMHi M - absolutely - Ms79 just has to be my best friend - otherwise I would be in deep trouble! :-)
Makes a change from images of recipe ingredients yes? ;-)
Posted by: Jag on November 16, 2003 09:47 PMOh, no! This wasn’t in college but in my past life as a 6 Sigma Green Belt, circa May’02! I still didn’t use Minitab much though as most of my time was spent trying to gain buy in from stakeholders.
Posted by: Ritu on November 16, 2003 11:05 PMAha - six sigma! I’m with you now. I haven’t had the fortune of participating in a formal six-sigma system. Although we did study GE and Jack Welch a intensely - including sime six sigma stuff.
Posted by: Jag on November 17, 2003 07:56 AMVery Well Explained Jag! :))
Say my hii to your 2nd best friend..
Thanks Chakra! I sure will! :-)
Posted by: Jag on November 17, 2003 09:28 PMKudos to the gr8 mathematical prof who has taught me statistics and prob. distr. better that my math profs… Good work , and different frm all the recipes. A nice engineering one for a change
Posted by: sat on November 18, 2003 04:21 AMgoodness…i know jag u very creative, but y use stats and spoil the whole thing!
p.s. I hate stats!
Hi Sat: glad you appreciate the beauty of the statistical method.
Shobha: Apologies! (I hate stats too - but I like the curves!)
Posted by: Jag on November 20, 2003 08:56 AMgreat post Jag…and amazingly beautiful pictures…but i didn’t understand a word of the statistics, i’m afraid! I enjoyed trying, though :-)
Posted by: Sue on November 25, 2003 11:01 PMHey Sue - yes - the pics were beautiful I have to admit - and I agree that the stats is hard going! I can’t pretend that I really understand it all either!
Posted by: Jag on November 26, 2003 12:02 AMif i want to normal curves for different means when s.d is equal.and for different s.d whaen means are equal,can u tell me where can i draw the curves .
Posted by: durgaprasad on September 23, 2004 05:00 PMI was confused with all the pictures but i cant complain shes the hottest
Posted by: ranj on December 15, 2004 11:35 PMstastics has never been more interesting
Posted by: ranj on December 15, 2004 11:37 PMGood to see two good things together.. beauty and Stats…
Pankaj
Posted by: pankaj on February 23, 2005 06:35 AM